Campus Plans (pdf)
Campus Plans are available for institutions as PDFs back to 2012.
Select any filter and click on Apply to see results
Success Strategies by Category
Success Strategies by Category
Success Strategies by Category are available from 2023
Pages
Middle Georgia State University
Middle Georgia State University has five campuses located in urban and rural cities in the center of the state of Georgia. The university is dedicated to providing a dynamic, learning-centered, caring and technically advanced environment of excellence. As a residential institution, the university pursues innovative opportunities to provide services to its traditional and non-traditional students and will maintain a recognized legacy of affordable higher education and community support services of the highest quality.
Middle Georgia State University Institutional Profile
Middle Georgia State University Campus Plan Update 2015
Institutional Mission and Student Body Profile
Institutional mission
Middle Georgia State University (MGA) educates and graduates inspired lifelong learners whose scholarship and careers enhance the region through professional leadership, innovative partnerships, and community engagement. Our vision is to transform individuals and their communities through extraordinary high learning. There are four core values that underscore this vision. They are stewardship, engagement, adaptability and learning.
About Middle Georgia State University
MGA is comprised of five campuses: Macon, Cochran, Dublin, Eastman, and Warner Robins. It has the only public funded School of Aviation. The institution covers a radius of just less than 200 miles. The mix between the student demographics and student enrollment patterns by campus significantly impacts the identification, the implementation and analyzation of MGA CCGA strategies and metrics in order to drive completion growth. Our institution is a young -hybrid institution, for which some of our students must travel to other campuses in order to complete a degree, take a mix of distance learning, face to face and online courses to complete his/her degree. This is atypical for most of our sister institutions.
|
Macon |
N = 3,512 26.% are new students Average age: 23.6 (this has steadily dropped over the past 5 years) Mixture of full time/part time/mostly commuter/small residential 2.62% are classified Learning Support Students |
Dublin |
N=438 38% are new students Average Age: 22.53 Predominately Freshmen/Sophomore students Only 4% are Learning Support Students (18) 76% are from Laurens County |
|
|
Cochran |
N=1,976 46% are new students Average Age: 20.80 21% classified as Juniors and Seniors Only 14% are Learning Support Students (285 with 43 in University College) Students from 126 counties in GA |
Eastman |
N=319 30% are new students Average Age: 22.65 Slightly more than 1/3 of the students are classified as juniors/seniors Only 2% are Learning Support Students (6) Students from 66 counties in GA and 39 from Out of State |
|
|
Warner Robins |
N=1,283 28% are new students Average Age: 25.21 41% classified as Juniors/Seniors Only 4% are Learning Support Students (45) 121 Veteran Student |
|||
Strategic Planning and Integrity of the Data
The Complete College Georgia (CCG) strategic plan submitted Fall 2012 was an amalgam of strategies from two distinct institutional plans; institutions which had historical differences both in mission and service area. The day-to-day work of consolidation for the new institution founded January 2013 quickly highlighted for the Provost where the 2012 plan was misaligned with the realities of the dynamics of organizational behavior in times of transition. Project management teams created to do the work of consolidation were purposefully populated with representatives from units of the institution most impacted by the work of that team. Complete College Georgia had to have an institutional focus. Quick fixes launched in isolation would not bring about the retention and completion results desired by Enrollment Management and Academic Affairs.
Fall 2013, the first semester of enrollment of students at Middle Georgia State College was the start of the baseline for MGA and from which to judge the impact of the recruitment, retention, and completion rates for MGA. This fall semester, the Provost commissioned two on-site external reviews (“deep dives)”focused on MGA’s institutional data systems to identify structural barriers, implementation barriers and system barriers (e.g. resource, people, etc.).
Student Demographics
Middle Georgia State University serves a diverse student body through traditional and hybrid delivery of curriculum on five campuses, as well as, distance learning opportunities that may transcend the service delivery area. While the data is not robust enough to identify stable trends, there is data that is noteworthy and should be closely monitored for emerging trends. MGA’s student body is predominantly full-time, traditional age, female, Caucasian, and Georgia residents.
A complete profile of MGA’s 2014 Student Body Characteristics is provided in the table below. The percentage of student body from the prior year, sans actual numbers, is included in the table for comparison
Select Student Body Characteristics Fall 2014
|
# |
% of Total Enrollment |
Ethnicity/Race |
# |
% |
||||
|
Fall 2014 |
Fall 2013 |
2014 |
2013 |
|||||
|
Full-Time |
4,809 |
60.70% |
62.10% |
Hispanic |
276 |
3.50% |
3.40% |
|
|
Part-Time |
3,118 |
39.30% |
37.90% |
American Indian/Alaskan Native |
20 |
0.30% |
0.30% |
|
|
Student Level |
# |
% |
Asian |
204 |
2.60% |
2.60% |
||
|
Freshman |
2,727 |
34.40% |
37.90% |
Black Non-Hispanic |
2,625 |
33.10% |
33.80% |
|
|
Sophomore |
1,702 |
21.50% |
19.80% |
Native Hawaiian/Other Pacific Islander |
11 |
0.10% |
0.10% |
|
|
Junior |
1,298 |
16.40% |
15.50% |
White Non-Hispanic |
4,535 |
57.20% |
56.30% |
|
|
Senior |
1,764 |
22.20% |
21.60% |
2 or More Races |
220 |
2.80% |
2.90% |
|
|
Other* |
436 |
5.50% |
5.20% |
Unknown |
36 |
0.40% |
0.60% |
|
|
Gender |
# |
% |
Residency |
# |
% |
|||
|
Male |
3,311 |
41.80% |
40.70% |
Fall 2014 |
Fall 2013 |
|||
|
Female |
4,616 |
58.20% |
59.30% |
Georgia |
7,662 |
96.70% |
96.60% |
|
|
Age |
# |
% |
Out of State |
208 |
2.60% |
2.60% |
||
|
< 25 years |
5388 |
67.90% |
69.90% |
Out of Country |
57 |
0.70% |
0.80% |
|
|
> 25 years |
2539 |
32.10% |
32.10% |
Other Demographic Data |
# |
% |
||
|
Fall 2014 |
Fall 2013 |
Fall 2104 |
Fall 2103 |
|||||
|
Average Age |
25.2 |
24.7 |
Pell Eligible |
4992 |
62.50% |
62.50% |
||
|
Students Requiring Remediation |
733 |
9.90% |
9.10% |
|||||
|
% age student body served through |
956 |
12% |
||||||
*Other includes dual enrollment, transient, and other special student populations
Sources: USG Semester Enrollment Report, USG Cognos Report, and MGA Banner
Examining the student body through multiple lens began this past year but is clearly in its’ infancy. One example of note is that 2% of the students who are served through the Office of Disability Services are diagnosed with Asperger’s Syndrome. Of that number, 7.4% prefer to take their courses on the Warner Robins campus. Based on feedback from the students and the counselors who have interviewed the students it is concluded that the Houston County high schools have better diagnostic and accommodation resources which helps the student reach their potential for post-secondary opportunities, they still live at home with their families which provides them with a support system, and the Warner Robins campus learning environment is less chaotic and has a better student to teacher ratio.
Institutional Completion Goals, High-Impact Strategies and Activities
For the 2014-2015 academic year, the institution focused on three goals, a continuation of the work begun in 2013. By narrowing the scope of the work as was outlined in the 2013-2014 plan, the institution was more successful in engaging the different units of the institution in a productive discussion about our students and their needs. The CCG efforts on behalf of our students also revealed areas for continuing improvement in processes and services. While presented as stand alone goals the success of one is interdependent on the success of the other two. Where appropriate to answer the question, common narrative will be found in each of the tables. The diversity among the goals are the process and outcomes metrics.
|
Goal 1: |
Increase graduation rates |
||||
|
High Impact Strategy |
Two academic advising tools were instituted: (1) MyDegree (DegreeWorks) and (2) Student Advising Alert System (SAAS) an EAB product. |
||||
|
Summary |
A professional development plan was crafted by the Office of the Provost and vetted by the President. Rather than open sessions for interested persons, the training was mandated and delivered at the program level or to personnel who work together in service offices. This delivery model allowed for exploration of the usefulness of MyDegree and SAAS within the context of their work. The training team had representatives from Academic Affairs, Office of Technology Resources and the Registrar’s Office. Over ninety percent (90%) of faculty representing all campuses, all Professional Advisors, and a few personnel in strategic service offices participated in the training. By 2020, MGA’s one year full time student retention rate as an institution will be 85%. |
||||
|
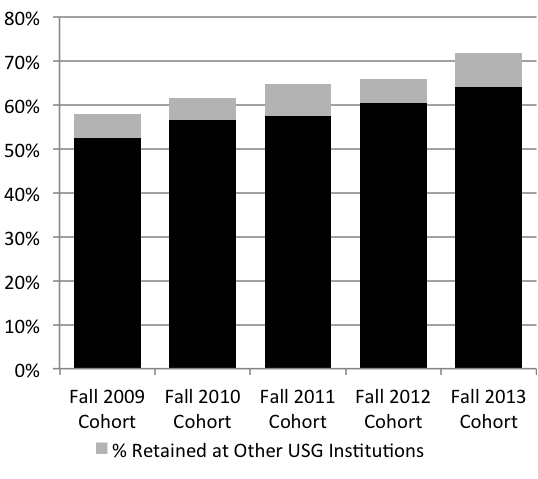
Baseline status |
Progress metric 1.1: 5-year history of one-year retention rates for the institution as a whole Progress metric 1.2: 5-year history of one-year retention rates who begin as full-time students Results: One-Year Retention Rates FTFTF Figure 1 One-Year Retention Rates FTFTF
Progress metric 1.3: 5-year history of retention rates for students who begin as part-time students Results: Table 1 Retention Rates Part-Time Students
Source: MGA Blackboard Analytics |
||||
|
Interim Measures of Progress |
Metric: Percentage of persons trained in using MyDegree and SAAS to support academic advising Results: 90% of faculty trained in using MyDegree for academic advising. Only Professional Advisors and faculty in three degree programs participated in professional development for SAAS. Metric: Percentage of persons using MyDegree and SAAS to support academic advising Results: MyDegree is the most frequently used tool by faculty and most Professional Advisors. Data reports show that the Professional Advisor for the athletes is the most prolific user of SAAS. |
||||
|
Measures of Success |
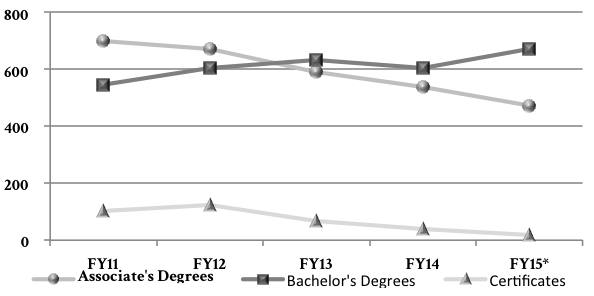
Outcome metric 1.2: 5-year history of number of associate degrees conferred by institution Outcome metric 1.3: 5-year history of number of bachelor’s degrees conferred by institution |
||||
|
Lessons Learned |
What steps or programs has your campus taken to address the identified challenges?
|

|
Goal 2: |
Increase graduation rates |
|
High-impact strategy |
Two academic advising tools were instituted: (1) MyDegree (DegreeWorks) and (2) Student Advising Alert System (SAAS) an EAB product. |
|
Summary of Activities |
A professional development plan was crafted by the Office of the Provost and vetted by the President. Rather than open sessions for interested persons, the training was mandated and delivered at the program level or to personnel who work together in service offices. This delivery model allowed for exploration of the usefulness of MyDegree and SAAS within the context of their work. The training team had representatives from Academic Affairs, Office of Technology Resources and the Registrar’s Office. Over ninety percent (90%) of faculty representing all campuses, all professional advisors, and a few personnel in strategic service offices participated in the training. An academic advising hold was placed on all students forcing them to speak with an advisor before registering for classes. |
|
Baseline status |
Data show a gradual increase in collegiate credits earned at time of graduation for the institution from 121.5 average credit hours Spring 2013 to 127.3 average credit hours Spring 2014. The increase in hours appears to be institutional since the average credits by transfer students have remained fairly stable [range 50 – 52.8]. MGA requires most first time freshmen to take a 3 hour FYE course. The Office of the Provost will be evaluating the effectiveness of this model and determine if this is a factor in the increase of hours at graduation. |
|
Interim Measures of Progress |
By 2020, MGA’s one year full time student retention rate as an institution will be 85%.
|
|
Measures of Success |
Outcome metric 1.2: 5 year history of number of associate degrees conferred by institution Results: Figure 1 Five Year History of Degrees Conferred The data reflects the deactivation of several low enrollment associate degree programs and an increase in access to 4-year degree programs across the institution. Outcome metric 1.3: 5-year history of number of bachelor’s degrees conferred by institution Results: Figure 1 Five Year History of Degrees Conferred Figure 2 Five Year History of Degrees Conferred
|
|
Lessons Learned |
What needs or challenges to achieving these completion goals that have been identified?
What steps or programs has your campus taken to address the identified challenges?
|

|
Goal 3: |
Provide intrusive advising to keep students on track to graduate |
|
High-impact strategy |
Two academic advising tools were instituted: (1) MyDegree (DegreeWorks) and (2) Student Advising Alert System (SAAS) an EAB product. |
|
Summary of Activities |
A professional development plan was crafted by the Office of the Provost and vetted by the President. Rather than open sessions for interested persons, the training was mandated and delivered at the program level or to personnel who work together in service offices. This delivery model allowed for exploration of the usefulness of MyDegree and SAAS within the context of their work. The training team had representatives from Academic Affairs, Office of Technology Resources and the Registrar’s Office. Over ninety percent (90%) of faculty representing all campuses, all professional advisors, and a few personnel in strategic service offices participated in the training. |
|
Baseline status |
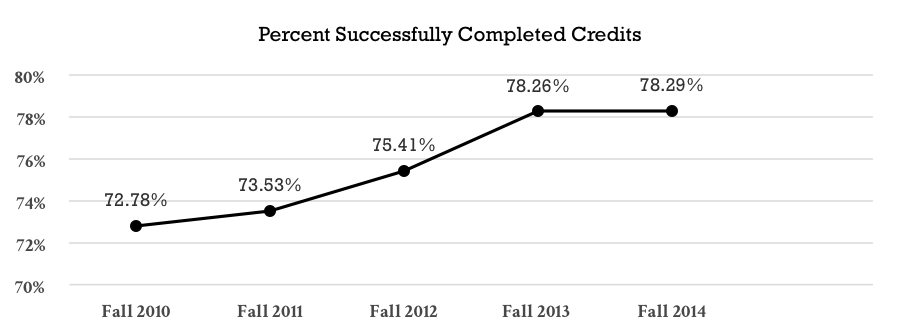
Outcome Metric 4.1 Percentage of credits successfully completed (A,B,C,P,S) versus attempted (A,B,C,D,F,U,W,WF) each fall semester for the past five years. |
|
Interim Measures of Progress |
Intrusive advising cultures are emerging. As examples, the Department of History contacts all majors with 100 hours and has them meet with a faculty advisor to finalize the degree completion path. All faculty in the School of Information Technology have assigned advisees. Each semester they provide academic advising via digital communication, in addition to face-to-face meetings. Collaborate is their tool of choice. |
|
Measures of Success |
By 2020, MGA’s one year full time student retention rate as an institution will be 85%. Outcome Metric 4.1 Percentage of credits successfully completed (A,B,C,P,S) versus attempted (A,B,C,D,F,U,W,WF) each fall semester for the past five years. Results:
|
|
Lessons Learned |
What needs or challenges to achieving these completion goals that have been identified?
What steps or programs has your campus taken to address the identified challenges?
|

Observations
Overall, the data show that Middle Georgia State University is making progress in the retention and program completion of students. Accolades for our success belong to the faculty and the staff who did not waiver in their responsibilities to our students in the face of so many rapid and seemingly chaotic organizational transitions. MGA invested in a new Vice Provost for Academic Quality which includes Institutional Effectiveness. Mr. Andy Clark (A.B.D.) begins Nov. 18, 2015. One of his first charges will be to address data issues between Academic Affairs, Enrollment Management, and OTR. The outcome will be data integrity trustworthiness and transparent metrics for improvement. A second key position was to convert the Associate Provost to Vice Provost of Student Success. Under Dr. Pam Bedwell all student success initiatives and personnel will be realigned in order to drive the needle on retention, progression, and graduation. Two personnel positions from other units are in the process of being aligned with the Office of Academic Affairs to improve student success on the Dublin Campus and with our special populations (GAMES, MOWR, University College, transfer students, and Freshman Success). In addition, President Blake brought in three external entities to conduct deep dives into technology utilization and infrastructure, enrollment, and retention. The final reports will be submitted to the President in December, 2015. This will also drive the direction of MGA as it improves its recruitment, retention, progression, and graduation.
However, it is abundantly clear in order to move the needle on increasing graduation rates for 2020, the institution needs to do the following structural corrective actions and narrow the intentional focus on specific initiatives in the 2015-2016 year:
- Articulate, align, and publish MGA’s success metrics with all institutional entities.
- Build cross functional and accountable coalitions between academic and non-academic units that impact positively student success.
- Clearly identify specific student success initiatives for the institution as whole and campus specific student success initiatives aligned with the varying student enrollment populations.
- Implementation of EAB Advising Campaigns
- Implementation of Freshman Meta Majors
- Redesign of Freshman Core – High D,W,F courses
- Analyze and evaluate MGA’s current offerings of baccalaureate degrees to determine if we are offering the right degrees which meet our state university mission and market needs for middle Georgia region thus enhancing student success beyond graduation.
- Implement MGA’s (QEP) Knowledge @Work :Exploration and Application beyond the Classroom . Knowledge@Work strengthens student learning and engagement by increasing participation in an array of experiential learning opportunities – opportunities which involve students in practical application of their learning. These high-impact practices can include internships, undergraduate research, and service learning